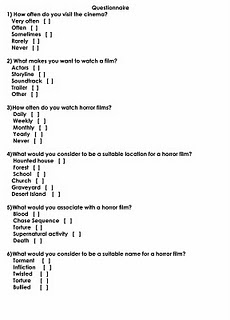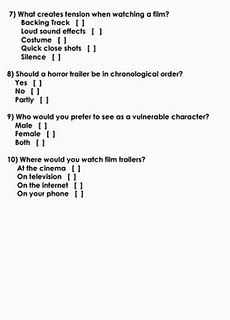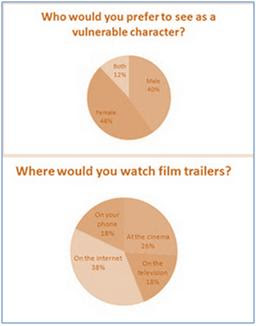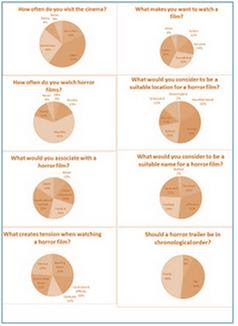

After collecting and analysing all the data, i decided to show the results by using pie charts. I feel this is a very clear and efficient way to show the results as it shows which criteria is most liked in a very easy to read format. Such as the title of the film, which is going to be 'Infliction'


No comments:
Post a Comment